
+ 45 Maximizing Cycles
Maximizing our cycles is something we are all trying to do to the best of our ability. I’m a firm believer in planning your cycles efficiently and well in advance. To do this some simple things need to be understood. If you can grasp these simple concepts that you can visually see your cycle before you start which is a big benefit. One of the first concepts is the half-life of a steroid. By understanding what a half-life is and how it affects a cycle you can safely lengthen or shorten your cycles with maximum benefits. While this is not a paper on half-lives it is important to understand how they work. I have written another article on half-life math here Half Life Math
Basically half-life works by clearing a certain amount of drug every hour or every day. It’s not quite as simple as halving itself every half-life interval. If we were to give ourselves one shot only then it would be relatively simple to calculate what our plasma levels would be. But this is not how we plan or do our cycles so the math is different.
In addition to understanding half-lives it is also important for us to understand what the Area Under the Curve is. When a drug profile is made plasma levels are calculated and charted to create a graph. Most of these profiles create a curve going up and to the right, leveling off or plateauing until the drug is stopped and then the curve shifts moving down and to the right. Some may remember from statistics that this looks like some form of a bell curve. Try to visualize an arch. On the left of the arch is zero and it represents the beginning. As your plasma levels increase you begin to move up and to the right. This represents the loading phase of the cycle and is relative to the length of the cycle dependent on goals and maximum gains. After the loading phase you reach what is called a steady state. This is the phase we want to get to as soon as possible as it represents maximum strength and gains. Now the steepness of the slope going up the arch is very relevant because the steeper the incline the faster you will get to steady-state and the faster you get to steady-state the longer you make your optimal gains at the peak of the cycle. The steepness or slope rather of the curve going up the arch is impacted by the intervals between shots and the half-life of the steroid. This is where the idea of frontloading comes from. By doubling up our doses you shorten the amount of time it takes to get to steady-state as well as lengthens the median dosage by ramping up to it very rapidly. The median dosage is the average milligram amount at the steady-state. Remember this as it is not the same thing as the overall cycle average. Now comes’ the end of the cycle where the curve continues to the right and down. This obviously represents the dissent of the cycle as we are coming off and no longer injecting any compounds.
If we were to step back and look at the arch and look at the journey we made from start to finish you will find that under the arch is not nothing but actually is space. Valuable space, in the area between the start and finish of the arch you could build small shops and stores. Like real estate, space is valuable. So imagine that the bigger your arch or curve the more you can fit under it. This is what is known as the area under the curve in pharmacokinetics. This is very valuable to pharmaceutical companies who are developing new products for the market. They use sophisticated mathematical models to tell a story of the drug profile and how big or small the area under the curve is.
The area under the curve actually does have a quantitative value. That means if you can figure out what that number is in relation to a specific cycle, you could compare the cycles to one another to make a more educated decision. For example on a basic test cycle of 500 per week the area under the curve looks like illustration 1.
Basic 12 Week Cycle Test E
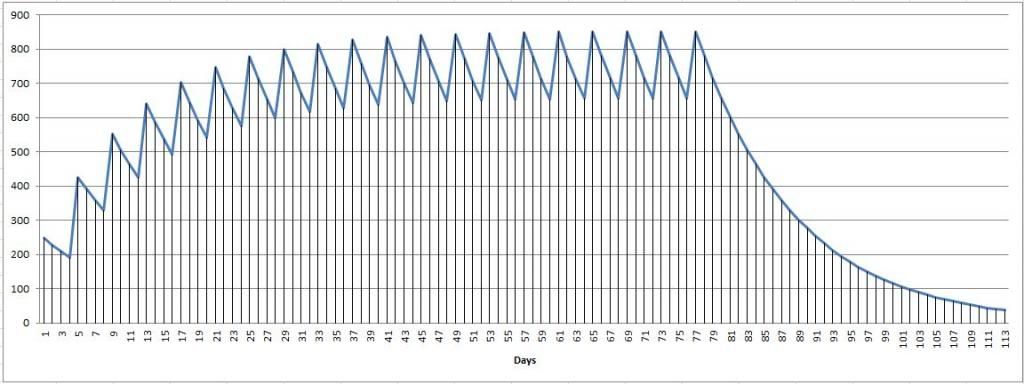
Illustration 1
In this example the area under the curve represented by the shaded lines is approximately 51,088 units. Notice how the slope to the top is gradual and you don’t reach steady-state until 4 ½ weeks. Also as you can see the median amount is 695 mg. This represents the average plasma level while in the steady-state. Now look at illustration 2.
Illustration 2 Basic Test Cycle with Front load
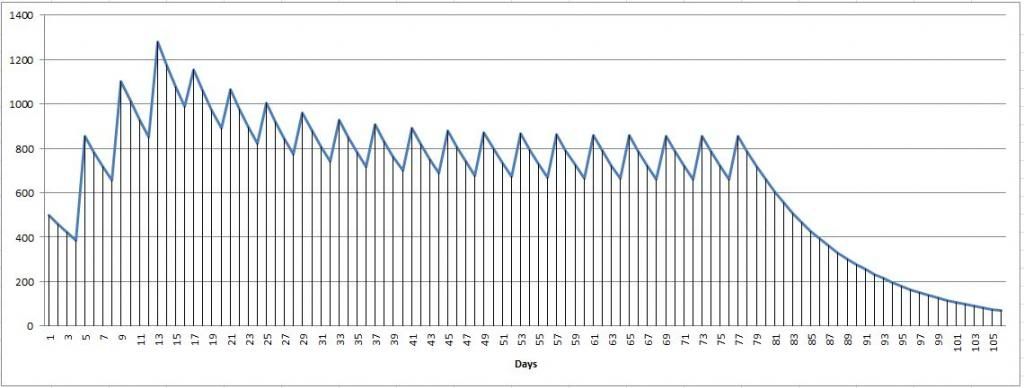
Look at the front loaded cycle and notice the area under the curve. It is almost 20% larger than the regular cycle at approximately 62, 986. Also see how quickly there is a progression to the steady-state with a median dosage of 807 mg. As you can see it makes more sense to have the largest area under the curve possible. Notice how we can change the speed at which we get to steady-state. At day 13 we are significantly higher than the median range. This is better than slowly ramping up to peak.
Knowing a little bit about the importance of the curve we can change the dynamic of the cycle. Some ways to achieve this can be as simple as shortening the duration between shots. By making the intervals smaller we can increase the curve and in most cases create a more stable plasma level. Here I have done a chart on a Sustanon cycle I’m getting ready to run. By seeing what the propionate curve looks like I can determine the maximum and the minimum shot interval I can get away with and still maintain stable plasma levels. In this case my shot interval will be every two days at 500 a week. If I were to change this interval to every other day I would increase the gain but also increase the shots from 52 to 76 and 500 to 750 week. Now you can actually alter the weekly dosage by drawing out of a vile instead of an amp. You simply would need to draw less than 1 ML. But this could make things complicated. Additionally we can alter the propionate curve by simply injecting another ml of test propionate. See illustration 3
20 Week Sustanon Cycle at 500 per Week Front loaded
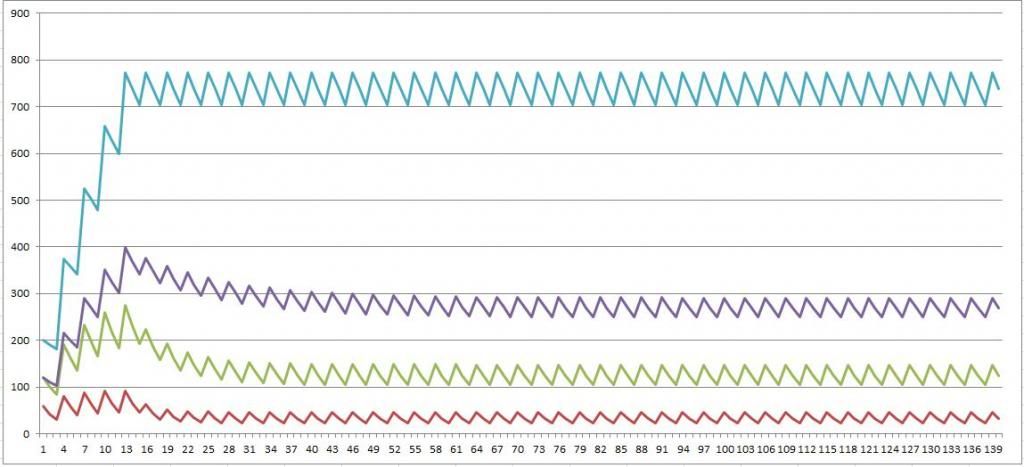
Illustration 3
This is how I plan my cycles each and every time. This has helped me save money and maximize gains. In addition to charting and planning my cycles I draw several blood tests to compare my levels to the numbers in the chart. I realize this is more in depth than most want to get but I feel understanding the basic principle would be beneficial to developing future cycles. If you have gotten to the bottom of this article and thank you for reading it.
- Bookmark
- 45
- 0
Haha I love it! Like your name too brother! Is that for Niccolo Machiavelli the Italian philosopher?
I agree about keeping things simple. It doesn't matter how complicated something is or not if you cannot get your point across then its all for nothing.
I appreciate your words and think it would be fun to knock around some ideas!
MakaveliCD7Niccolo Machiavelli.....is correct!!! Yes definitely need to knock around some ideas
Chaz32621Great post +1
This post just made my head explode. But nowadays its all about saving money so my cycles have to be smart .Totally awesome read thank you
The half life is how long it takes for half of compound to metabolized. So for EQ, the half life is about 15 days (give or take depending on about a million factors). This means that if you take 1g EQ a week and inject it once a week, by the end of the first week your body will have metabolized and cleaved less than half of that 1g from the ester and made it available to bind to receptors (less than half because it follows exponential decay). The same story happens by the end of week two, except that you get a little more metabolized at the end of that week because you also have the EQ from week 1. This process continues until the rate your body is metabolizing the EQ from the ester is equal to the rate at which you are injecting the EQ. You have reached peak blood levels once this happens. At this point, you probably have several grams of EQ in your body, but, your body is only able to metabolize about 1g per week. As you can see, it takes several weeks for this to happen because of EQ's half life.
Now, the example I gave was injecting eq once a week. Most people inject EQ much more frequently than that, meaning that all the EQ you inject in week one does not spend the same amount of time in your body by the end of week 1. For example, if you inject 3x a week, the first dose is in your body longer than the second and third dose, so more of the first dose will be metabolized than the second and third dosages. Compare this to the previous example I gave and you can see that in this case the amount of EQ you metabolize by the end of week 1 is MUCH less than if you had injected it all at once. This effect continues and causes the time it takes to reach stable blood levels to be even longer.
That's why I personally think you're best off either frontloading or injecting longer ester compounds like EQ less frequently until peak blood levels are reached
So are you agreeing or disagreeing with me? You wrote pretty much the same thing I did. Talk about half life math in another post that I hyperlinked above.
Buildbigger86This is a terrific post Havoc. I appreciate very that you posted this. i am happy to able more about this.
Plus 1 from me
Great post
wow, +1 on this
AnonNice work cryhavoc bro! Where did u get ur halflife generator if u dont mind me asking?!
+1
I am not sure what you mean Muppet about the "generator" I got the half lives from Anabolics edition 9 and from various websites. In one case I found a pamphlet or insert rather in a buddies prescription Cyp box from Watson Pharmaceutical company. If your asking how I generate the plasma levels based on the half life I used the equations I posted in my Half Life Math article described above.
Try this site. I believe it has the info you want. You just choose the compounds and shows info. I am not sure if this is what you are looking, but will also help on your PCT starting dates.
http://pct.befit4free.net/
Hope it helps!!
The half lives listed and sourced on this website are accurate with my research as well. This was a good find! +1
Excellent Post. I always program my cycles in Excel, but the way you explained it graphically gives me a clear view of how the plasma levels actually are. Will try to graph one myself!!!
Solid post, do you have an entire spread sheets calculator made up, if so I would love to get a copy!
Yes and no. I have the spread sheets done for test e and Sust but they are not built off of a single sheet. I had to do the math individually for each compound. Though I suppose I could think up a way to write a template and then change the numbers depending on the compounds. But an individual would still have to understand the math to make it work. The math is not hard really. It's a little bit of calculus and a very little bit of statistics that's it. I would like to learn how to write a front end application in VBA so anybody could build a cycle but alas I am an engineer and not a programmer so that day isn't in my immediate future lol!
Great post. +1
good explanation +1
This makes the case for front loading very well. Great post.
I find this to be a very interesting read bro +1
nice post! thanks for the research.