i trying to load up the graphs, calculations etc for each test but it'll only let me get as far as 3 uploads..I'm assuming it's because i'm not a source yet.
That's the part of the testing that shows purity, but IDK why he left the rest out. Most people skip to the last page and never even look at the methodology, graphs, and calculations.
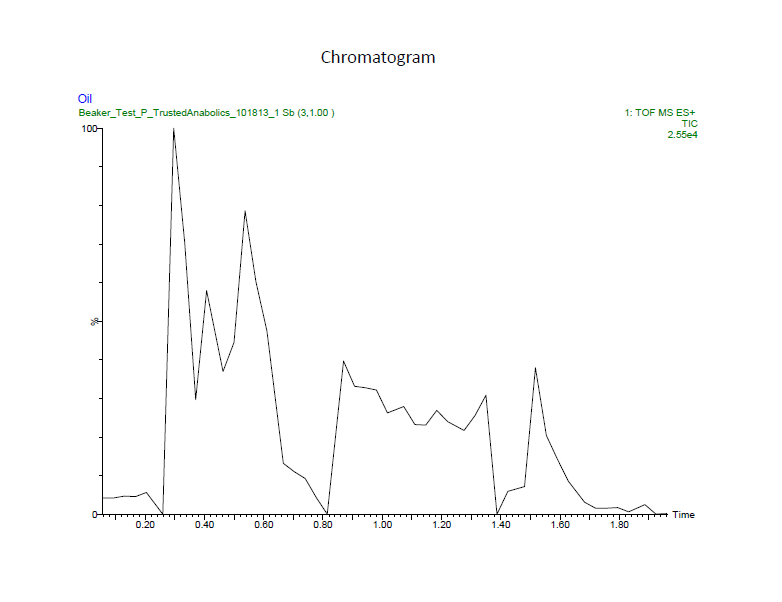
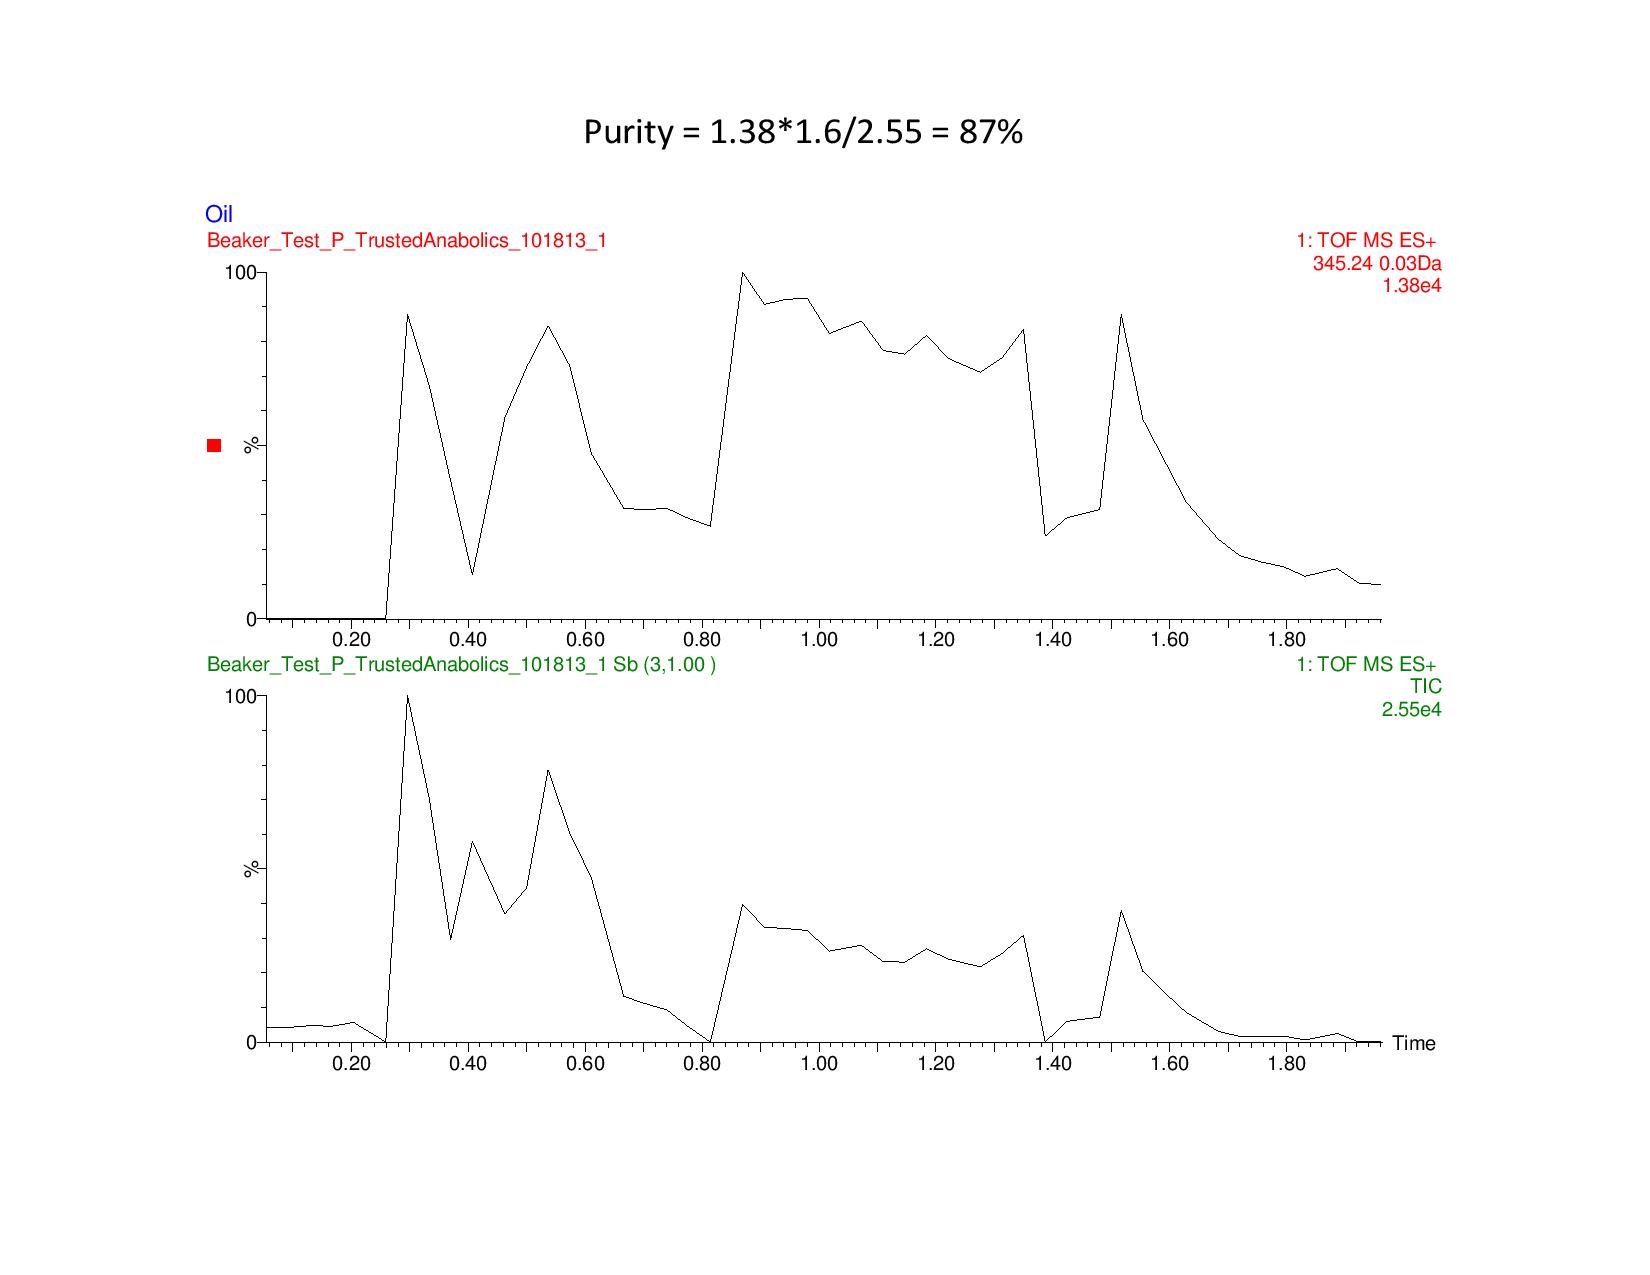
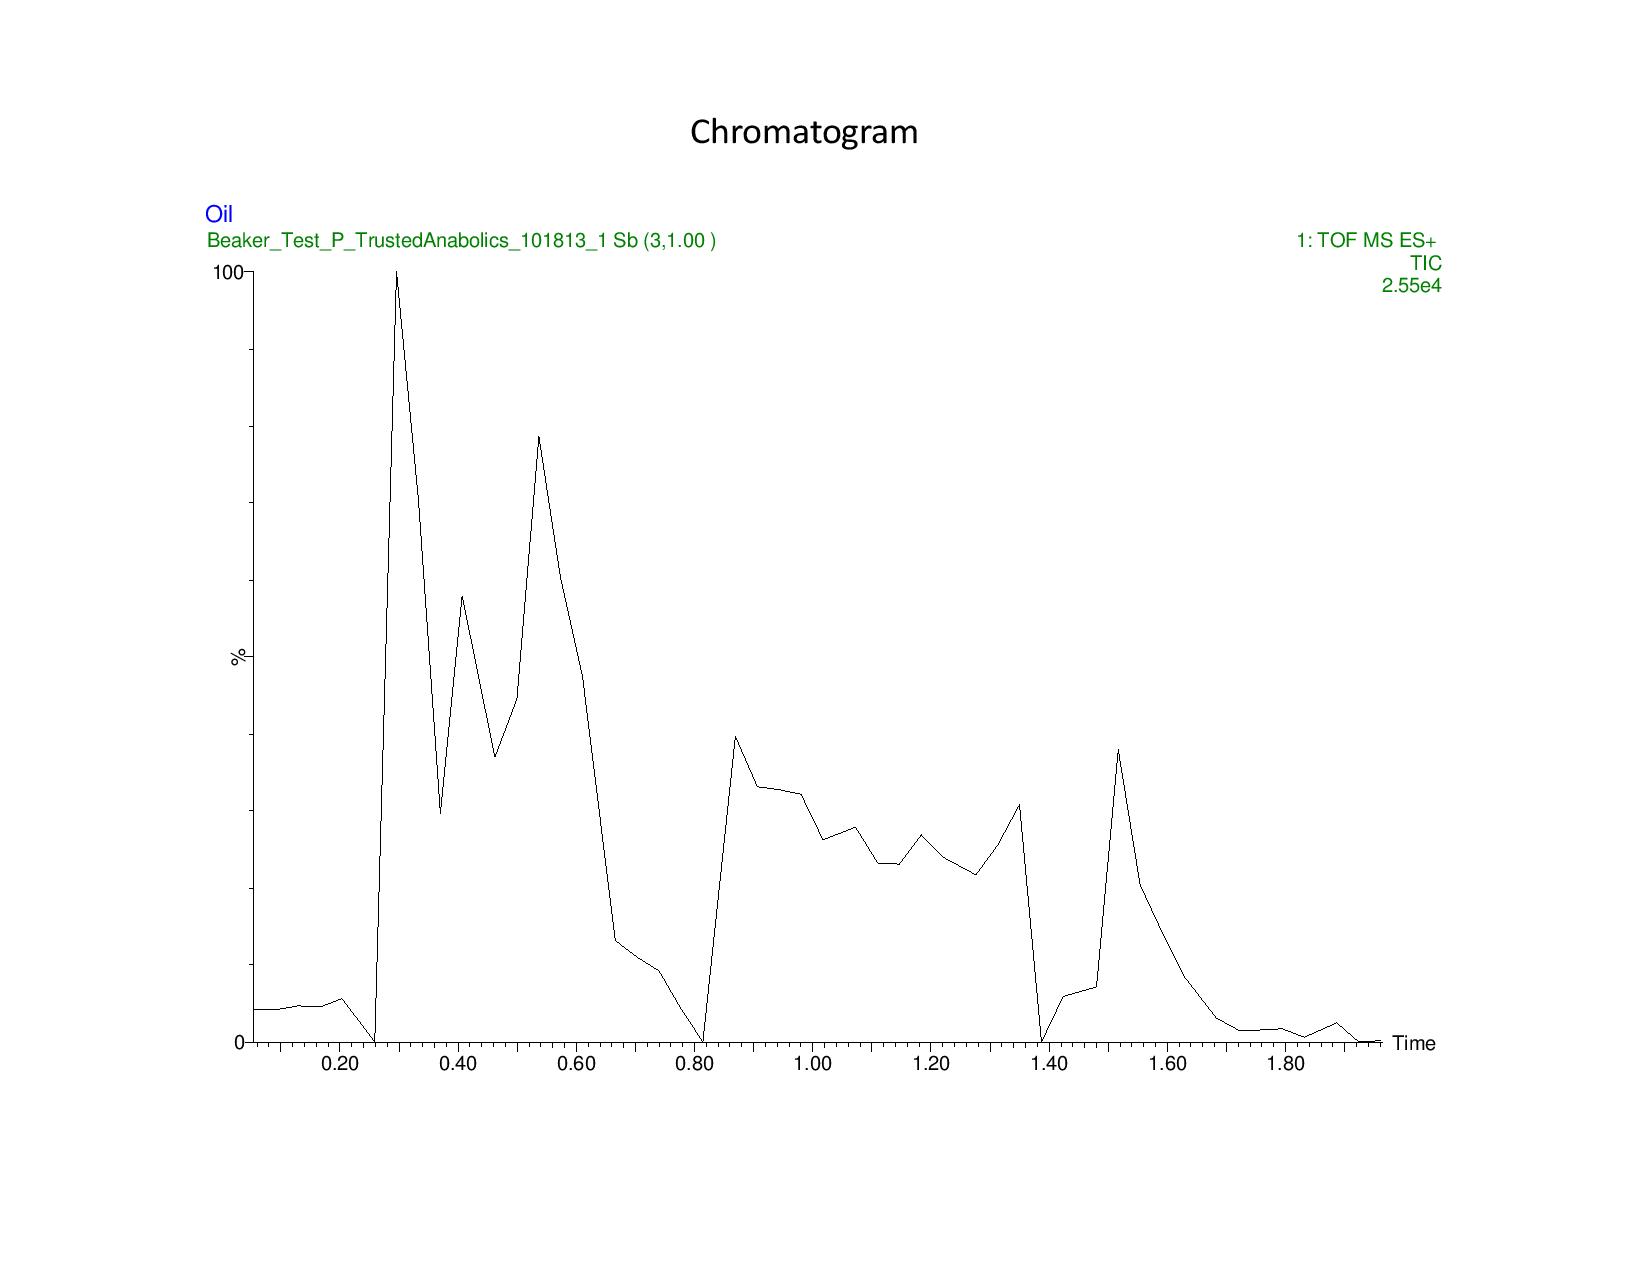
What we are looking at in these graphs that he has posted is the elemental composition, which is used to calculate the purity. It is a function of the high resolution mass spectrometer which we use in our testing. There are a quite a few calculations and parameters that have to be calculated and set. Those graphs are part of the visual confirmation that the test parameters are correct. Two different passes are made and documented which is why you see the two different graphs. It would be a significant write up to explain that but I found a very good link that isn't bad in its layout.
Mass Spectrometry has an amazing amount of variables and it's a matter of checking and double checking to verify accuracy. Which is why we see the chromatograph along with the elemental composition normally. And then for those that don't understand it we have the summary page.

NorthernTrusti trying to load up the graphs, calculations etc for each test but it'll only let me get as far as 3 uploads..I'm assuming it's because i'm not a source yet.
no clue what this means...
angusThat's the part of the testing that shows purity, but IDK why he left the rest out. Most people skip to the last page and never even look at the methodology, graphs, and calculations.
Yeah. That's what i was thinking. I actually check out the graphs when they come up, so I can try to better understand what I'm looking at.
any chance we can get a breakdown angus?
angusWhat we are looking at in these graphs that he has posted is the elemental composition, which is used to calculate the purity. It is a function of the high resolution mass spectrometer which we use in our testing. There are a quite a few calculations and parameters that have to be calculated and set. Those graphs are part of the visual confirmation that the test parameters are correct. Two different passes are made and documented which is why you see the two different graphs. It would be a significant write up to explain that but I found a very good link that isn't bad in its layout.
http://www.research.uky.edu/core/massspec/jeolelemental.pdf
Mass Spectrometry has an amazing amount of variables and it's a matter of checking and double checking to verify accuracy. Which is why we see the chromatograph along with the elemental composition normally. And then for those that don't understand it we have the summary page.
Awesome. Thanks for the link.
I was just thinking the same thing lol